Take plasma samples from 500 Nepalese children, analyze them for nutrient levels using conventional biochemical methods and for proteins using quantitative mass spectrometry. Compare the results. You may just have the answer.
Keith West, Bob Cole and colleagues at the Bloomberg School of Public Health and School of Medicine, Johns Hopkins University, Baltimore, USA, did precisely that as part of a Gates Foundation funded-project that aims to investigate the potential for a more rapid, universal platform for screening micronutrient levels (1). Cole provided insight into the analytical aspects of the research. “We figured that proteins are most likely up- and down-regulated in relation to levels of micronutrients in the body, and that their correlation could be found in blood,” says Cole. With that thought in mind, the group set out to find correlations between nutrient levels and individual proteomic profiles and, “Amazingly enough, we actually did.”
The first protein and nutrient that showed a strong correlation in the system was the well-known pairing of vitamin A and retinol-binding protein (RBP). “It was very satisfying to see the correlation pop right out of the whole analysis in this way; we weren’t directly looking to measure RBP4,” says Cole, “we were actually measuring everything. Seeing RBP4 levels change relative to the amount of vitamin A proved we’d got something and validated the assay”.
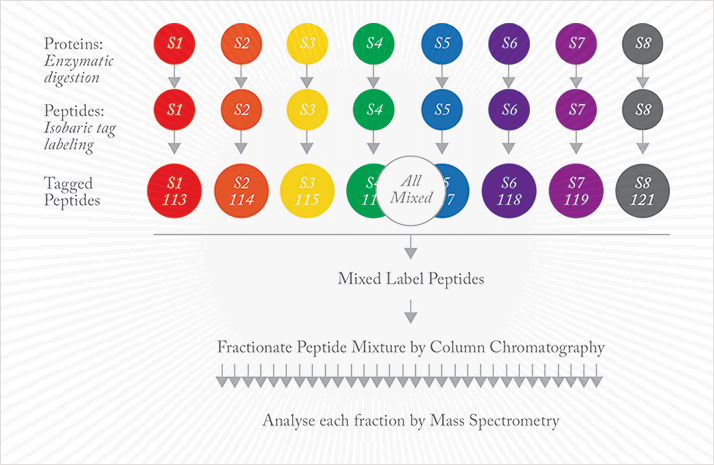
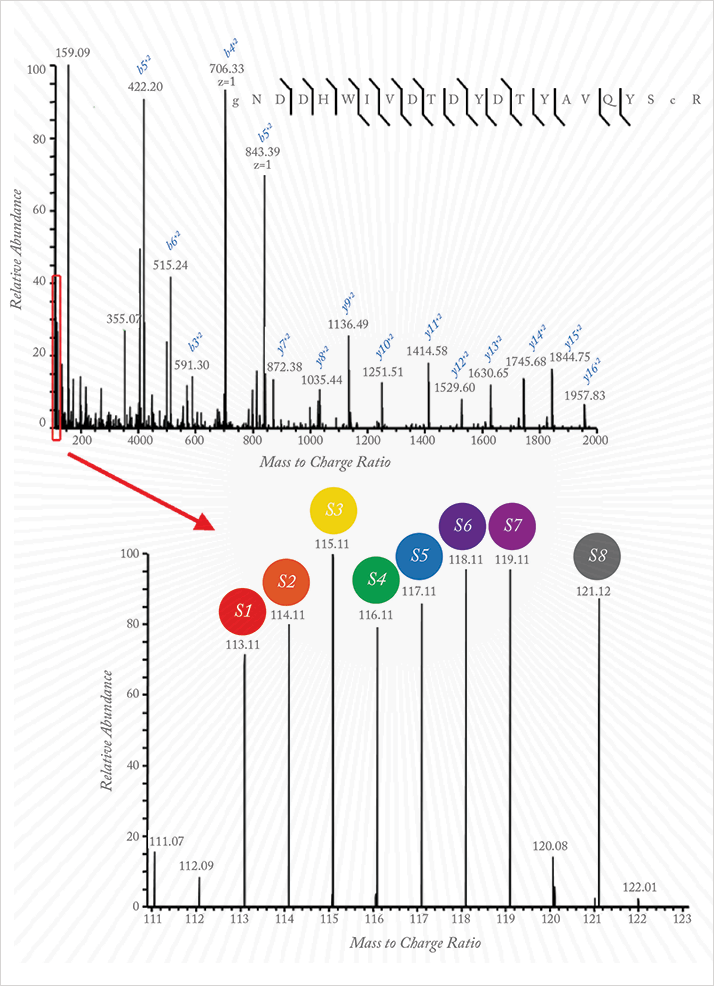
“The biggest challenge for me was the sheer number of samples that Keith wanted to analyze in order to gain sufficient statistical power.” To lighten the load, Cole used iTRAQ reagents in an isobaric mass tag approach (see Figures 1 and 2). “Multiplexing the analysis allowed us to look at more than one sample per assay. That saves a lot of time. It also provides direct comparison of those samples with each other”. In each run, eight samples were individually digested and labeled with a different iTRAQ tag, then combined and fractionated using HPLC. “Standardization of each step was very important; when we analyzed each of those fractions on our MS platform (Thermo Orbitrap Velos), we needed the results to be as reproducible as possible.”
The team identified 4705 proteins, with 982 found in at least 50 of the children. “Employing a linear mixed effects model, we observed a number of correlations in addition to vitamin A and RBP4 (r = 0.88), namely, 25-hydroxyvitamin D and vitamin D-binding protein (r = 0.58); α-tocopherol and apolipoprotein C-III (r = 0.64); copper and ceruloplasmin (r = 0.65); and selenium and selenoprotein P isoform 1 (r = 0.79)”. Clearly, traveling around the rural areas of developing nations with a huge and complex system is not the end goal. “The objective was always to identify sets of proteins directly associated with nutrients in plasma to allow us to design a much simpler platform that measures those biomarkers,” says Cole, “To that end, we are in talks with experts at the forefront of simplified microassays for proteins.” Beyond the potential to benefit populations in the developing world, there are whispers of extending the application to personalized medicine. Watch this space.
Newsletters
Receive the latest analytical science news, personalities, education, and career development – weekly to your inbox.

References
- R. N. Cole et al., “The Plasma Proteome Identifies Expected and Novel Proteins Correlated with Micronutrient Status in Undernourished Nepalese Children”, J.Nutr.143, 1540-1548 (2013) DOI:10.3945/jn.113.175018