Smaller particles are used to obtain higher resolution. If these particles are packed in GPC/SEC columns with smaller inner diameters (compared to traditional analytical columns) an efficient separation can be achieved that needs less mobile phase. Traditionally micro columns are run at a reduced flow-rate of 0.35 ml/min, but modern materials can be also operated in the flow-rate range of 0.5 - 0.7 mL/min to save not only mobile phase, but also time. Typical column dimensions for micro columns are e.g. 150 to 250 mm length and 4.6 mm inner diameter.
Unlike in UHPLC, in μGPC/SEC it is not the extremely high pressures that are a challenge but the cell volumes of the typical GPC/SEC detectors. If the cell volume is too large, the previously separated oligomers will be back-mixed in the detector cell and the advantage of small particle sizes and dedicated micro columns is lost. Cells with small volumes are already available for many UV/DAD, however for the most common GPC/SEC detector, the refractive index RI, only very few models are suitable. With the PSS SECcurity µRI an RI with the smallest cell volume (1.7 μL), specifically designed for use with micro columns is now available. The detector can be seamlessly retrofitted at any time in PSS SECcurity GPC systems as well as in Agilent 1260/1290-Systems.
For this application note, PSS SDV columns, a polymeric crosslinked styrene-divinyl benzene material, have been used to investigate the resolution and the performance of the PSS µRI for oligomeric polystyrene. An advantage of polymeric stationary phases over silica based materials is that less interactions are observed. In addition, it is easier to construct a column set that is mismatch free to cover a wider molar mass range.
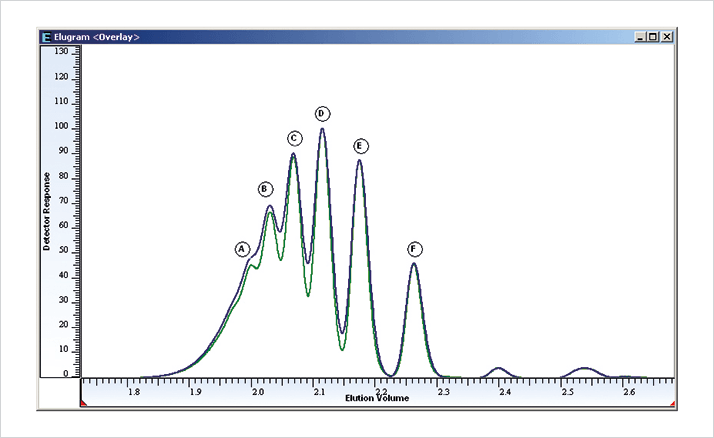
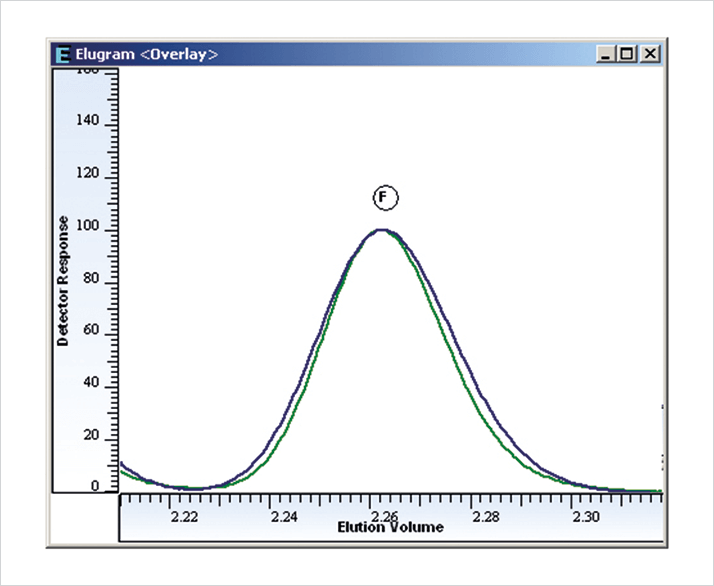
Figure 1 shows a comparison of the separation of an oligomeric polystyrene on two polymer based PSS SDV micro columns with small particles using a analytical SECcurity RI with 8 µL cell and the PSS µRI with a 1.7 µL cell. Although the analytical RI already has very good performance, it is possible to detect more oligomers with the µRI detector. In addition to the higher resolution, the µRI detector also shows less signal broadening. Figure 2 shows a magnified comparison of the two traces for Peak F – it is clearly visible that the peak for the µRI is narrower.
Website: www.pss-polymer.com
Newsletters
Receive the latest analytical science news, personalities, education, and career development – weekly to your inbox.