Introduction
The Mark–Houwink plot is a powerful tool for investigating polymer structure in solution as it clearly reveals the structure-molecular weight relationship with high sensitivity. It is generated by plotting the molecular weight (MW) against the intrinsic viscosity (IV) on a log-log graph. The molecular weight, of course, indicates the length of the polymer chains (or degree of polymerization) but on its own cannot give any indication of structure. The intrinsic viscosity (expressed in dL/g) is a measurement of the molecular density of the polymer chains in solution. The tighter the chains fold or coil in solution, the higher the density and the lower the intrinsic viscosity. This measurement is independent of the molecular weight, so two different structures having the same molecular weight can have different intrinsic viscosities – for example a linear (unbranched) polymer and a branched polymer of the same molecular weight will have different intrinsic viscosities. Furthermore, if the polymer changes structure across its molecular weight distribution (e.g. becomes more substituted), the intrinsic viscosity changes will be easily detected. This is what makes the Mark-Houwink plot so useful and powerful.The raw data for the Mark-Houwink plot is conveniently and simply obtained from high quality multi-detection GPC/SEC data by combining the molecular weight from a light scattering detector with the intrinsic viscosity from a viscometer detector. Both data sets are measured at each point across the elution profile of the sample. The resulting plot can be used in many ways from simply assessing how close two structures are to making complex quantitative measurements of polymer branching. In this application note, we will show how to separate the effects of a structural difference induced by a compositional change to a polymer (e.g. substitution) and the structural change induced by polymer chain branching.
Materials and methods
Samples were separated using two Viscotek T6000M columns. The mobile phase was THF stabilized with 300 ppm BHT. Samples were allowed to dissolve overnight to ensure full dissolution. The data in this application note was generated using the Malvern OMNISEC system shown in Figure 4, which was set up as follows:- Flow rate: 1.0 mL/min
- Autosampler temperature: 15 °C
- Column oven temperature: 35 °C
- Detectors temperature: 35 °C
Results
All three polymers are easily and successfully chromatographed under these conditions and a triple detection chromatogram of each of the three samples is shown in Figure 1, in each case showing the low angle light scattering (LALS), RI and viscometer signals.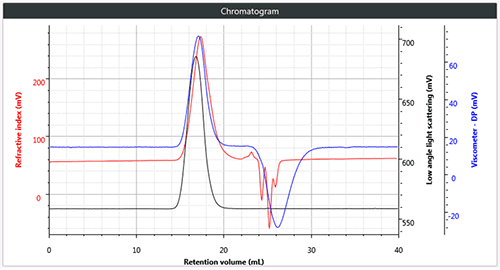
Figure 1 (a) Triple chromatogram of linear (unbranched) polystyrene
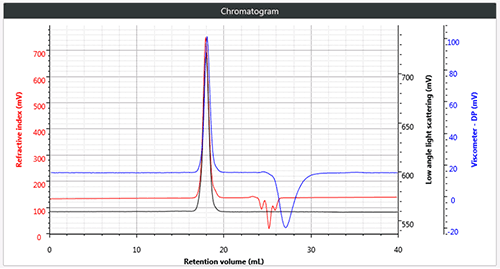
Figure 1 (b) Triple chromatogram of star branched polystyrene
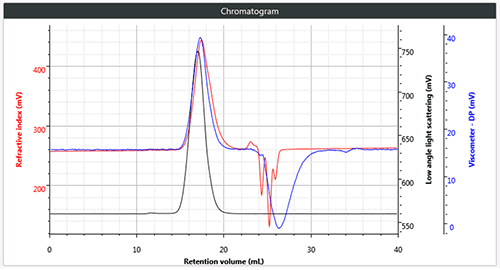
Figure 1 (c) Triple chromatogram of brominated polystyrene Click here to access the application note
Malvern provides the materials and biophysical characterization technology and expertise that enables scientists and engineers to investigate, understand and control the properties of dispersed systems. These systems range from proteins and polymers in solution, particle and nanoparticle suspensions and emulsions, through to sprays and aerosols, industrial bulk powders and high concentration slurries. Used at all stages of research, development and manufacturing, Malvern’s instruments provide critical information that helps accelerate research and product development, enhance and maintain product quality and optimize process efficiency. Our products reflect Malvern’s drive to exploit the latest technological innovations. They are used by both industry and academia, in sectors ranging from pharmaceuticals and biopharmaceuticals to bulk chemicals, cement, plastics and polymers, energy and the environment. Malvern systems are used to measure particle size, particle shape, zeta potential, protein charge, molecular weight, mass, size and conformation, rheological properties and for chemical identification, advancing the understanding of dispersed systems across many different industries and applications. www.malvern.com Material relationships http://www.malvern.com/en/
Newsletters
Receive the latest analytical science news, personalities, education, and career development – weekly to your inbox.