Introduction
The physical properties and behavior of polymers and polysaccharides depends strongly on the properties of the molecules themselves. Molecular weight and molecular weight distribution, molecular size and structure all affect how the material will behave. Gel-permeation chromatography (GPC), also called size-exclusion chromatography (SEC), is the most commonly used tool for assessing these parameters. The principle of GPC involves separating the sample as it travels through a porous but inert column matrix. While smaller molecules penetrate the pores more deeply, larger molecules are excluded and thus travel through the column faster. The result is a separation based on hydrodynamic volume but the desire is to know the molecular weight of the sample. Previously, molecular weight was estimated by comparing the elution time of the sample to that of standards of known molecular weight. Now, however, a light scattering detector is a common tool that allows polymer molecular weight to be measured independently of retention time. The concurrent measurement of Rg using multi-angle light scattering (MALS) and intrinsic viscosity offers exceptional insight into the structure of synthetic and natural polymer molecules as well as their molecular weight. The Viscotek SEC-MALS 20 (figure 1) is a 20 angle light scattering device capable of making measurements of molecular weight and Rg (radius of gyration). It can be used as part of a multi-detector GPC system that combines light scattering with other detectors such as refractive index (RI), ultraviolet (UV) and intrinsic viscosity (IV) to generate a large amount of information about a sample simultaneously.
Figure 1: The Viscotek SEC-MALS 20 system
Materials and methods
The SEC-MALS 20 detector was connected to a Viscotek GPCmax and a Viscotek TDA system. Samples were separated using 2 x Viscotek A6000M columns (Dextran, Pectin, Gum Arabic) or one column (Pullulan, Hydroxypropyl cellulose). The mobile phase was phosphate buffered saline. The SEC-MALS 20 system was calibrated with a 19kDa PEO standard. The detectors and columns were all held at 35°C to ensure a good separation and maximize baseline stability. All samples were dissolved in mobile phase to a concentration of between 0.5 and 3 mg/ml and a 100µl injection volume was used. The dextran sample has a known molecular weight and was used to check the calibration. All samples were allowed to dissolve overnight to ensure full dissolution.Results
All of the samples were successfully separated on the system. Overlaid RI chromatograms are shown for the pectin, gum Arabic and dextran (figure 2A) and for the pullulan and HPC (figure 2B).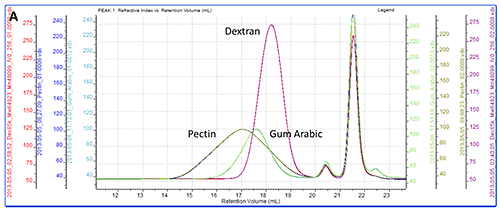
Figure 2A: Overlaid RI chromatograms are pectin, dextran and gum Arabic
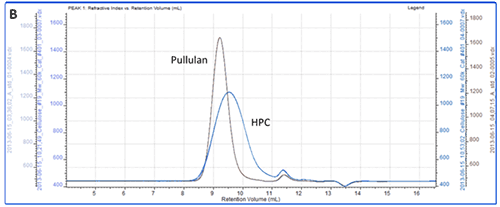
Figure 2B. Overlaid RI chromatograms or pullulan and HPC. As a more detailed example, a chromatogram of pectin is shown in figure 3A showing the RI, LS (90°) and IV detectors. Figure 3B shows the angular data from the SEC-MALS 20 detector. A slight angular dependence can be seen across the different angles allowing Rg to be measured for this sample. Figure 3C shows the RI peak overlaid with the measured molecular weight, Rg, IV and Rh.
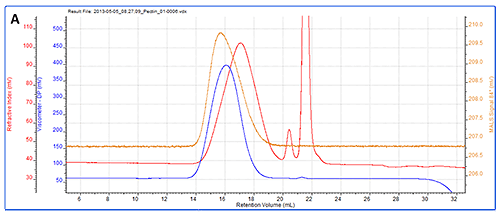
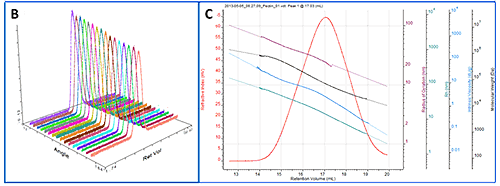
Figure 3: A. Chromatogram showing RI (red), LS (90°) (orange) and IV (blue) detector responses for pectin. B. Plot showing the MALS data. C. Derived data showing RI peak overlaid with Rg (maroon), molecular weight (black), IV (turquoise), Rh (teal). Table 1: Measured molecular weight distributions, IV, Rh and Rg values for the different polysaccharide samples.
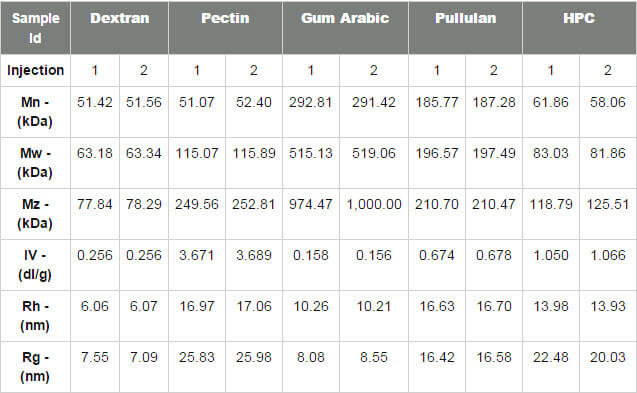
Table 1 summarizes the results for the different samples. Duplicate injections were performed and it can be seen that the repeatability between injections is excellent across all of the measurements. While study of the numerical results is an excellent quantitative way to compare samples, plotting the data on Mark-Houwink and Conformation plots is an ideal way to compare samples quickly from a visual perspective. A Mark-Houwink plot displays intrinsic viscosity as a function of molecular weight whereas a conformation plot shows Rg as a function of molecular weight. Both of these are therefore a way of visualizing the increase in size as molecular weight increases. They allow immediate comparison of different samples with respect to each other and are ideally suited to the study of branching and other structural changes. In this case though, we are just interested in seeing where the different polysaccharides fall on the plots. >> Download the full Application Note as PDF
Malvern provides the materials and biophysical characterization technology and expertise that enables scientists and engineers to investigate, understand and control the properties of dispersed systems. These systems range from proteins and polymers in solution, particle and nanoparticle suspensions and emulsions, through to sprays and aerosols, industrial bulk powders and high concentration slurries. Used at all stages of research, development and manufacturing, Malvern’s instruments provide critical information that helps accelerate research and product development, enhance and maintain product quality and optimize process efficiency. Our products reflect Malvern’s drive to exploit the latest technological innovations. They are used by both industry and academia, in sectors ranging from pharmaceuticals and biopharmaceuticals to bulk chemicals, cement, plastics and polymers, energy and the environment. Malvern systems are used to measure particle size, particle shape, zeta potential, protein charge, molecular weight, mass, size and conformation, rheological properties and for chemical identification, advancing the understanding of dispersed systems across many different industries and applications. www.malvern.com Material relationships http://www.malvern.com/en/ [email protected]
Newsletters
Receive the latest analytical science news, personalities, education, and career development – weekly to your inbox.