Introduction
Triple Detection GPC/SEC is a well-established technique for the accurate and complete characterization of macromolecules. The technique combines both light scattering and viscometer detectors with a refractive index (RI) detector and is applicable to both natural molecules, such as proteins or polysaccharides, and synthetic polymers. The resulting molecular weight and structure information provides an invaluable tool for macromolecular researchers. This document will help the practitioner of triple detection GPC/SEC to understand the theory behind the detector technology and have a greater appreciation of the strengths and limitations.1. The RI detector
1.1 Theory The most common type of RI detector in use today is often called the deflection type. As the name suggests, it is based on the deflection of a beam of light as it passes through a dual compartment flow cell, as shown in Figure 1(a). The deflection of the beam is measured by two photodiodes in a differential circuit. One side of the cell compartment contains the reference solvent of refractive index n0, which is static during the measurement process. The other side contains the sample solution, i.e. the column eluent, having refractive index n. The beam is refracted at the liquid-glass interfaces that separate the two compartments and also at the liquid-glass interface on the exit wall, and again at the glass-air interface on the exit wall. A rigorous analysis must take each of the refractions into account. Fortunately, a simplified analysis that ignores the glass interfaces as shown in Figure 1(b) yields substantially the same result as the rigorous analysis, so that derivation will be reviewed instead.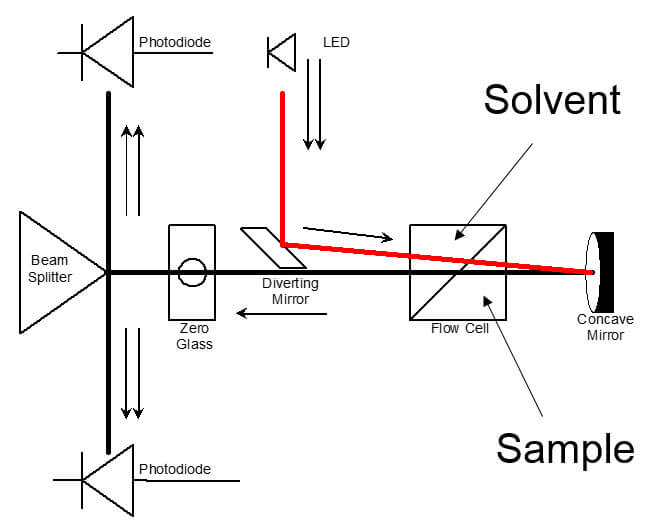
Figure 1: The deflection type refractometer Snell’s law of refraction can be applied to the hypothetical liquid-liquid interface shown in Figure 1(b) to yield equation 1:

For the very small angles of deflection encountered here, we may approximate with no loss of accuracy as follows:
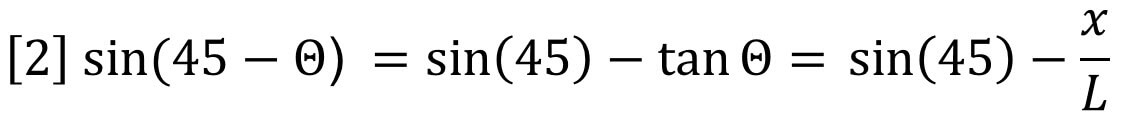
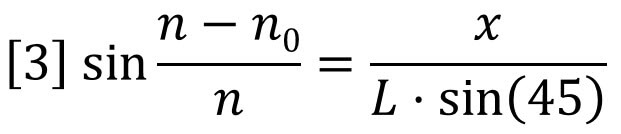
Combining equations 1 and 2 shows that the incremental refractive index is proportional to the deflection, x.
The differential signal will likewise be proportional to x because the beam, which actually has a finite width, will deliver more light to one photo-detector and less to the other as the beam is moved across the beam splitter due to refraction. Therefore we can combine instrument constants into one detector calibration factor. In addition, we can replace n by n0 because they are very nearly the same value at low concentrations.
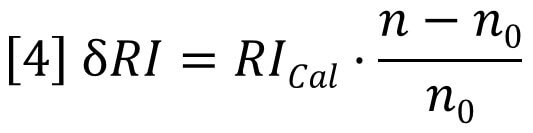
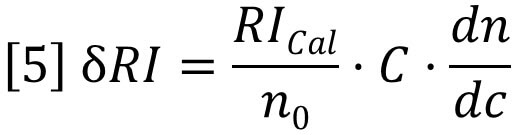
Where ∂RI is the change in RI detector signal and RICal is the calibration constant for the RI detector. If the RI detector is to be useful as a concentration detector, then the refractive index of the solution must be proportional to sample concentration - at least for dilute solutions. With batch RI analysis, where the sample compartment is not connected to the column eluent but is completely flushed with a solution of known concentration, one can test this assumption by plotting the measured signal against sample concentration. This procedure is shown in Figure 2, where the RI signal is plotted against concentration for two different samples, polystyrene and polybutadiene, both dissolved in tetrahydrofuran (THF). It can be seen that each sample yields a straight-line slope, but the intercepts are not at zero for either sample and the slopes are different.
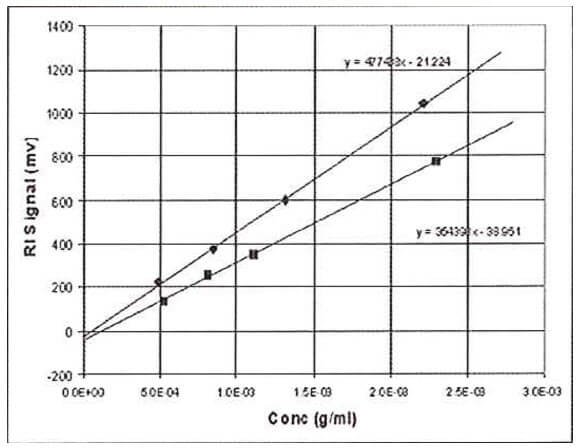
Figure 2: RI Data on polystyrene and butadiene using the batch method. Used for calibration or dn/dc determination The reason the lines do not intercept at zero is because the reference side of the refractometer unintentionally contained a slightly different solvent to that used to make up the sample solutions. Typically, for a solvent such as THF, atmospheric contaminants such as water and air itself will tend to decrease the RI of the samples to a significant extent. It is impossible with a batch experiment to make sure that the reference side of the RI detector is purged with solvent that has the exact composition of atmospheric contaminants as the sample solutions, because the sample solutions continually absorb moisture and air during the course of the measurements. Therefore, we must be content to find a linear relationship between RI signal and concentration. The fact that the slopes of the polystyrene sample and polybutadiene sample are different means that the RI is not only proportional to concentration, but also to a sample-dependent parameter. This sample-dependent parameter is called the refractive index increment, or dn/dc. The general equation for the RI detector is therefore expressed as follows:
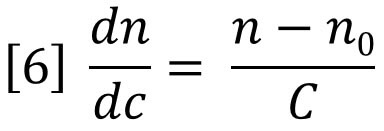
Therefore, dn/dc is the slope of a plot of refractive index against concentration. However, since the proportionality assumption requires the slope to be constant and the intercept equal to n0, the dn/dc is simply defined for a single solution of refractive index n and concentration C as follows:
Substitution of equation 6 into equation 5 yields equation 4 again. In order to use the RI detector quantitatively, the calibration constant RICal must be determined. Figure 2 and equation 5 together provide a logical way to do this calibration. The slope of either of the plots in Figure 2 is a composite of three variables. If any two of the three variables are known, the other can be calculated from the measured slope.
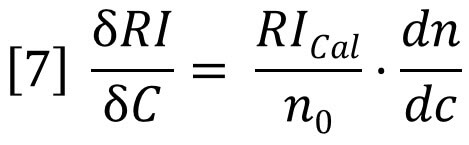
If dn/dc and the refractive index of the solvent are known, then the calibration constant is calculated from equation 7. This can be applied to the polystyrene data in Figure 2, with dn/dc taken to be 0.185 g/mL and refractive index taken to be 1.405. The value of RICal calculates to be 3.63x10⁶. Using this value for RICal, the dn/dc of polybutadiene calculates to be 0.137 g/mL, which is slightly higher than the literature values, which range from 0.125 to 0.130 g/mL. We will see later where this error comes from.
1.2 Chromatographic Method
The batch method is hardly convenient for the calibration or use of a chromatographic detector to calculate dn/dc. Columns must be removed and test solutions must be injected one by one, a laborious and tedious procedure. In addition, there is the atmospheric contamination problem, which can lead to a great deal of error if special care is not taken. It is much more convenient to inject the samples using an ordinary chromatography system with an auto-injector. Computer controlled data acquisition and processing then permits the calibration and calculations with a high degree of precision. It is necessary to reformulate the equations previously developed for this purpose. >> Download the full Application Note as PDFMalvern provides the materials and biophysical characterization technology and expertise that enables scientists and engineers to investigate, understand and control the properties of dispersed systems. These systems range from proteins and polymers in solution, particle and nanoparticle suspensions and emulsions, through to sprays and aerosols, industrial bulk powders and high concentration slurries. Used at all stages of research, development and manufacturing, Malvern’s instruments provide critical information that helps accelerate research and product development, enhance and maintain product quality and optimize process efficiency. Our products reflect Malvern’s drive to exploit the latest technological innovations. They are used by both industry and academia, in sectors ranging from pharmaceuticals and biopharmaceuticals to bulk chemicals, cement, plastics and polymers, energy and the environment. Malvern systems are used to measure particle size, particle shape, zeta potential, protein charge, molecular weight, mass, size and conformation, rheological properties and for chemical identification, advancing the understanding of dispersed systems across many different industries and applications. www.malvern.com Material relationships http://www.malvern.com/en/ [email protected]
Newsletters
Receive the latest analytical science news, personalities, education, and career development – weekly to your inbox.