The amount of sugar present in a wine determines its classification as a dry or sweet wine. Being a fruit product, wine can be expected to contain fructose and glucose and other additive sugars. Sorbic acid and citric acid are commonly used as acidulants and/or preservatives. Citric acids add a fresh taste, whereas succinic acid gives a more salty, bitter taste. The malic acid content gives wine its distinctive flavor and is also an indicator of the quality of the fermentation by the yeast in the wine. If the fermentation process is not properly controlled, any malic acid remaining can lead to spoilage from bacterial fermentation after bottling. Such wine is said to suffer from an imbalance of acid or to have spoiled. All listed compounds can be quickly analyzed by HPLC in combination with Eurokat H column, so that objective values related to sweetness, acidity, maturity and alcohol content can be obtained simultaneously with indication of deterioration or adulteration.
Results
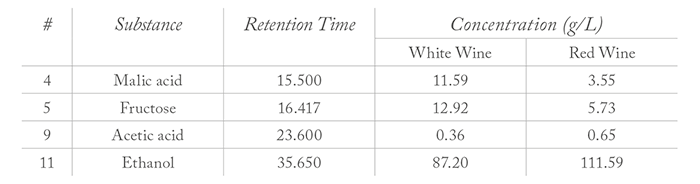
The substances citric acid, tartaric acid, glucose, malic acid, fructose, succinic acid, lactic acid, glycerol, acetic acid and ethanol were identified in different wines as being 12–13 percent of the sample weight (Figure 1). Interestingly, white wine contained a markedly higher amount of malic acid (11.585 g/L) and fructose (12.919 g/L) and less alcohol (87.202 g/L) in comparison to the red wine (Table 1) and all other wines analyzed. The wines analyzed gave an average total acid content of 7–8 g/L, with the exception of white wine. The concentration of volatile acetic acid was nearly 0.36 g/L in the white wine sample and, as expected, twice as high (0.65 g/L) in the red wine.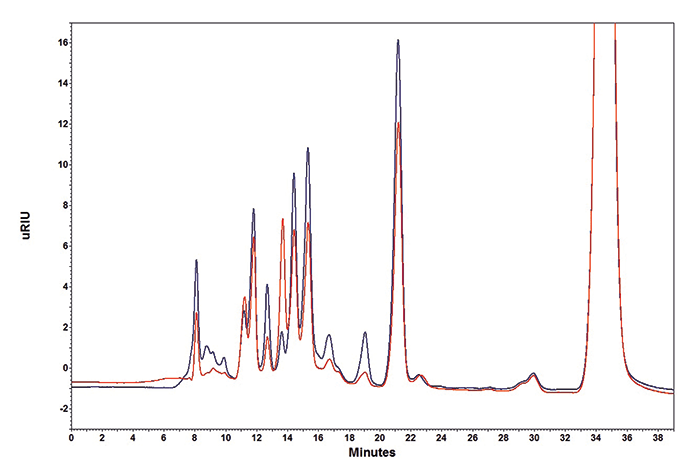
Discussion
This result allows us to conclude that the fermentation process proceeded quickly and then was prematurely stopped in white wine. Consequently, a wine is produced with high residual sugar content, and higher fructose and lower glucose concentrations. The flavor of the wine is dependent on the tartaric acid and malic acid concentrations, as well as the total acid content comprised mainly of lactic acid, citric acid, and succinic acid.Materials & Method
An AZURA Analytical HPLC Plus system was used for this application. The system consisted of an AZURA P 6.1L pump, a manual injection valve, an AZURA CT 2.1 column thermostat, an AZURA RID 2.1L refractive index detector and an Eurokat H column. Eurokat H is a sulfonated cross-linked styrene-divinylbenzene copolymer. The 40 min isocratic method ran at a flow rate of 0.6 mL/min of 1.25 mM sulfuric acid. The column thermostat was set to 85 °C and the data rate of the detector to 10 Hz. 20 μL samples were injected. Contact:Kate Monks
+0049 30 809727 320
Newsletters
Receive the latest analytical science news, personalities, education, and career development – weekly to your inbox.